Topic covered:

Introduction
A machine learning model needs dataset to get trained on it. A dataset has lots of limitiations which can make model perform poorly on unseen data. Therefore, before feeding the data to model during training, it require lot of preprocessing. One of the most important step in preprocessing is feature scaling. We will know about what is feature scaling and two common techniques Standardization and Min-Max
What is feature scaling?
A dataset has features which can be vary hightly on scale, range and units. For example, consider a feature length which can be in meter, foot, kilometer, etc. Length can be 1km or 1000m. If we calculate euclidean distance on length, it will vary more when length is in meter as compare to length in km because same magnitude appears to be larger in m. Why we are talking about euclidean distance because it is mostly used in ML models. One of the model is k-nearest neighbours. Higher magnitude can make the model more dependent on it. To remove and resolve this problem, we can think of bringing the feature to same order of magnitude. This is called Feature Scaling.
When we don't need scaling?
One of the ML model which is scale invariant is tree based algorithm. Without going deep and considering information gain or impurity, it is simple to think as some condition based dependence X_i>some_value? So in this case it doesn't really matter if X_i is in m or km.
When scaling is recommended?
Standardization
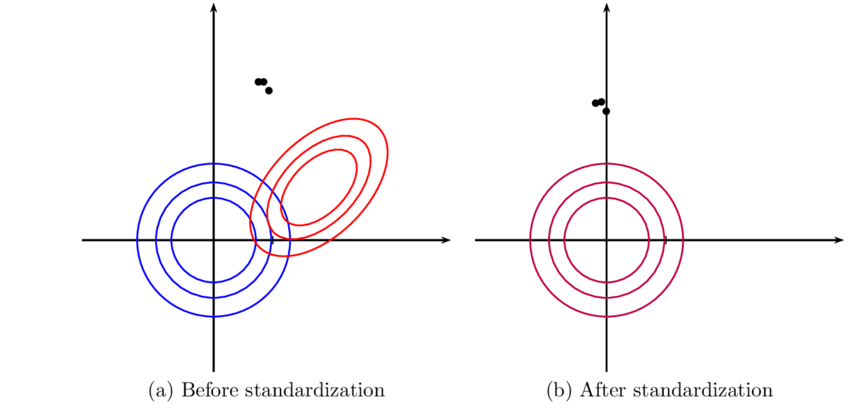
Standardization is simple feature scaling technique where values are replaced by z-score.
X_new(Z-score) = (X-X_mean)/(sqrt(var(X)))
where X_mean is sampling mean and sqrt(var(x)) is sampling standard deviation.
By doing this, we make new value to be around zero centric mean and unit variance.
X_mean_new = 0
var(X_new) = 1
Min-max Scaling
Alternative to z-score normalisation, Data is scaled in range from 0 to 1 usually.
X_new = (X - X_min)/(X_max - X_min)
Here we endup with smaller standard deviation and supress the effect of outliers.
Demonstration of scaling on PCA using Sklearn libraries.
The dataset used is the Wine Dataset available at UCI. This dataset has continuous features that are heterogeneous in scale due to differing properties that they measure (i.e alcohol content, and malic acid). To test whether effect of scaling, we can use classifier over PCA and analyse its performance. We have taken accuracy to analyse the performance. The classifier used is k-nearest neighbours.
| data | Accuracy |
|---|---|
| Unscaled data | 61.11% |
| Scaled data | 96.30% |
We can also note the difference from Plot defined below.
.png)
Conclusions
From
Swyam Prakash Singh
ML enthusiast